
Most B2B companies segment customers by size or industry: large accounts, mid-market, small; manufacturing, retail, healthcare. It is easy to set up and almost useless for deciding how to serve, price or cover each customer. Two customers of the same size in the same industry can buy in completely different ways.
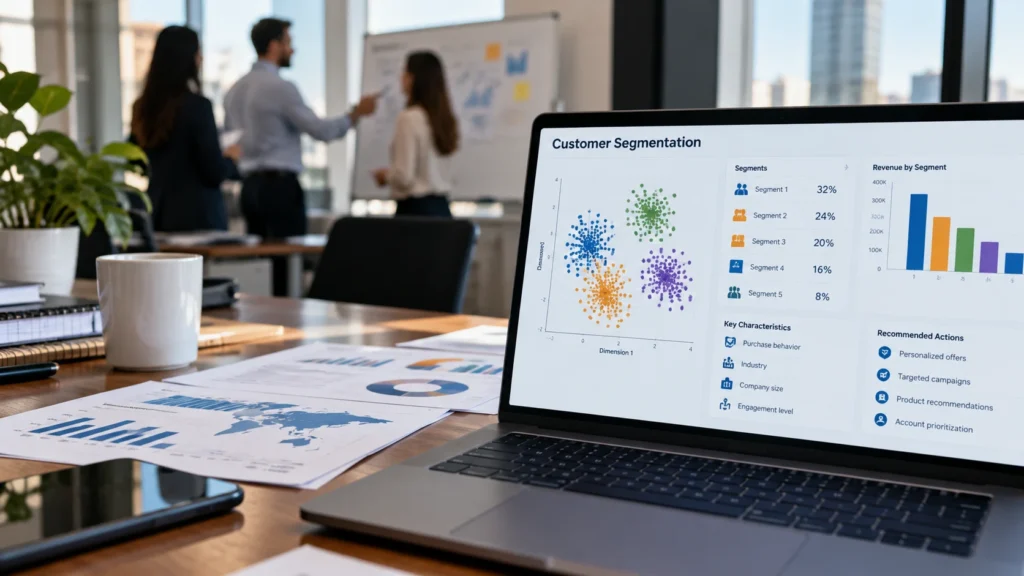
The short answer: B2B customer segmentation with data science groups customers by how they actually buy, using order history, product mix, margin and cost to serve, then adds firmographics on top. A clustering model finds the natural groups, the sales team names them, and each segment gets its own action. This is one of the most practical first projects in data science because the data already sits in the ERP.
Why Size and Industry Aren’t Enough
Firmographic segments describe who a customer is, not what they do. A large account that orders twice a year for projects needs a different approach than a small one that orders every week. Treating them the same leads to the wrong coverage, the wrong prices and sales time spent where it returns the least.
The Data That Makes Segments Useful
- Recency, frequency and value. How recently a customer ordered, how often and how much. This classic RFM view is the backbone of most behavioral segmentation.
- Product mix. Which categories each customer buys, and how concentrated their purchases are.
- Margin. Revenue alone hides customers who buy a lot at very thin margins.
- Cost to serve. Small orders, rush deliveries, returns and support requests all add cost that rarely shows up in sales reports.
- Firmographics. Industry, size and region, used to describe segments rather than define them.
B2B Customer Segmentation With Data Science: How It Works
- Fix customer identity first. Merge duplicates and link branches to their parent account. The approach in our data quality scoring framework applies here too.
- Build customer features. Turn order history into measures per customer: order frequency, average order size, margin, category mix, cost to serve.
- Find the groups. A clustering model, such as k-means, groups customers whose patterns are similar. The data suggests the segments instead of someone drawing lines by hand.
- Name them with sales. Review each group with the people who know the customers. A segment the sales team doesn’t recognize won’t be used.
- Give each segment an action. Coverage model, pricing approach, minimum order or service level.
- Refresh on a schedule. Customers move between segments. Recalculate quarterly and track who moved.
A Practical Example: An Industrial Supplier
Consider a supplier with about 2,000 active business customers, all sorted into three size tiers. A behavioral segmentation might reveal groups the tiers hide: contractors who buy large volumes at thin margins, small workshops that order weekly and cost a lot to serve, and project buyers who appear a few times a year with large, seasonal orders.
Each group calls for a different move. Volume contractors need margin discipline, which ties into pricing execution. Frequent small buyers may need a minimum order or an online channel. Project buyers need a rep who calls before the season, not after. The segments become useful when they show up in a dashboard sales managers open every week.
Common Mistakes to Avoid
- Too many segments. If a team can’t remember the segments, it won’t act on them. Four to seven is usually workable.
- Segments without actions. An analysis that ends in a slide deck changes nothing. Every segment needs a specific decision attached.
- A one-time project. Customer behavior shifts. Segments that aren’t refreshed drift away from reality within months.
The Bottom Line
B2B customer segmentation with data science replaces assumptions about customers with groups based on how they buy. Use order, margin and cost-to-serve data, let a model find the groups, validate them with sales and attach a clear action to each. Done well, it changes where sales time, pricing effort and service cost go.
Sisifo Analytics builds segmentation models on ERP and CRM data, as part of our data science services, and delivers them in the tools your team already uses.
Want to see how your customers actually group? Book a 30-minute call with our team and we’ll walk through what your data can show.