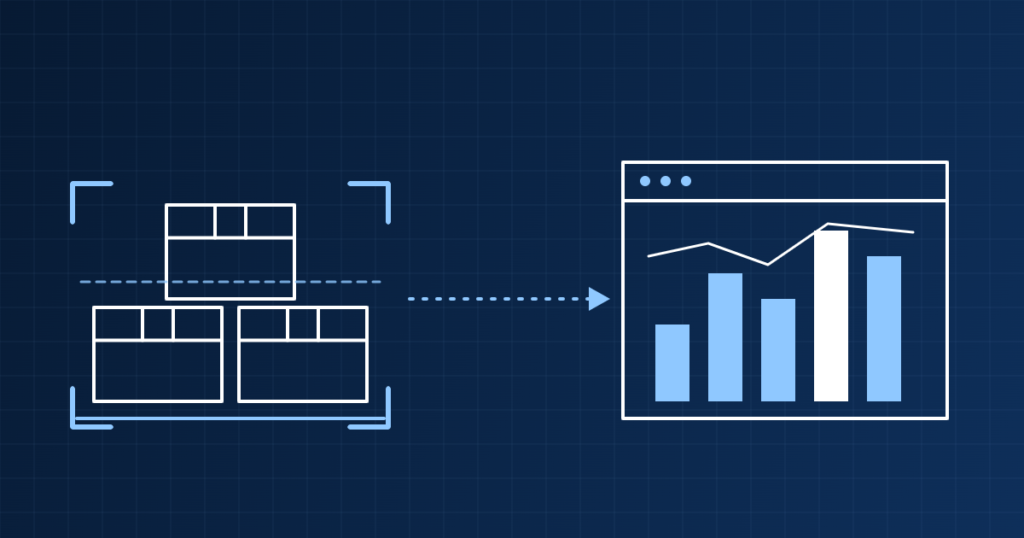
Most companies that come to us asking for “better dashboards” don’t actually have a dashboard problem. They have a data capture problem that a dashboard can’t see past.
It’s an easy mistake to make. Inventory data feels off, reports don’t match reality, and the instinct is to invest in more sophisticated business intelligence tools: better visualizations, more filters, real-time refreshes. But if the numbers feeding those dashboards are wrong at the source, no amount of visualization layer will fix them.
The Real Problem: Undigitized Process Steps
In manufacturing, agribusiness, and distribution operations, we consistently see the same root cause behind unreliable inventory data: the steps where physical goods actually move (receiving, staging, returns, discards, and manual adjustments) are still tracked on paper or in disconnected spreadsheets. The ERP or core system of record only captures a fraction of the actual movement, usually at the point of final shipment.
The result is predictable: inventory discrepancies in the range of 5-6% between physical counts and system records, adjustments that can’t be traced back to a reason or an owner, and finance and operations teams that quietly stop trusting the numbers altogether. If this sounds familiar, our guide to scoring data quality is a good place to start.
Fixing Inventory Data at the Source
The fix isn’t a better dashboard. It’s digitizing capture at the point of activity, before the data ever reaches a report:
- Point-of-activity digitization. Replacing paper tickets and end-of-day spreadsheets with tablet or mobile capture at receiving, staging, and dispatch closes the gap between when something physically happens and when it’s recorded.
- OCR and AI-assisted data entry. For inputs that still arrive as paper (delivery tickets from third-party suppliers, for example), optical character recognition combined with a human confirmation step gets data into the system fast without asking already-busy teams to re-key everything manually.
- A “committed” versus “available” inventory state. Many operations lose accuracy because there’s no formal state for inventory that’s been staged for shipment but not yet dispatched. Modeling that as a distinct, tracked state, rather than letting it fall through the cracks, closes one of the most common blind spots we see.
Computer Vision as an Independent Check
Once the core data capture is solid, computer vision adds a second, independent layer of verification: not as a replacement for the system of record, but as a way to catch what it misses. Cameras trained on warehouse or plant activity can:
- Estimate on-hand inventory and cross-check it against logged transactions.
- Track cart, pallet, or forklift movement to flag bottlenecks and idle time.
- Generate heat maps of activity that reveal where physical layout is slowing operations down.
Used this way, computer vision becomes a reconciliation tool, a way to catch drift between what the system believes and what’s actually happening on the floor, rather than a black box making decisions on its own.
Measuring What Actually Matters
None of this is worth doing without clear, upfront KPIs. The programs that succeed define success before they start building:
- Variance between physical and system inventory counts, with a realistic glide path (for example, from under 3% in an initial phase toward 1% over time).
- Number and pattern of manual adjustments, and whether they can be traced to a reason and an owner.
- Time elapsed between a physical movement and its system record.
- Manual hours eliminated: daily physical counts, spreadsheet reconciliation, and similar work that a reliable system makes unnecessary.
The Bottom Line
If your team is asking for a better dashboard, it’s worth asking a prior question first: is the data feeding it actually trustworthy? In our experience, the highest-leverage investment in analytics almost never starts with the reporting layer. It starts with digitizing the physical process, adding independent verification where it’s cheap to do so, and only then building the dashboard on top of a foundation that’s actually solid. The same logic applies before any ERP migration, and it is the backbone of building a single source of truth.
At Sisifo, we help operations and manufacturing teams close this gap, from data capture and pipelines to computer vision and executive dashboards, so that analytics investments are built on data leadership can actually trust.
Interested in how this applies to your operation? Get in touch with the Sisifo team at sisifo.ai.